
The week before Christmas, Winter Storm Gail was a powerful Nor'easter that hammered the Northeast from December 16-17, 2020. Gail left a wide swath of snow accumulations reaching 18-24" with some locations receiving 30-36"+ amounts. Gail was so powerful that it reached an RSI of 12.13 which is considered a "crippling" winter storm. However, there were no direct impacts within the Erie, PA region - or so it seemed, until recently.

The Allegheny Reservoir encompasses approximately 33 square miles and is located within the Allegheny National Forest in Pennsylvania and the Allegany State Park in New York. This reservoir was created in the 1960s following the construction of the Kinzua Dam. The dam was an engineering marvel of its time - standing 179 feet tall, 1877 feet long, and 1245 feet wide. The lake created by the dam has a normal elevation of 1327 feet and is about 24 miles in length. The development of the dam paid off shortly after when the remnants of Hurricane Agnes dumped 6-10 inches of rain across Pennsylvania in only a few days. During this time, it is estimated that the new dam prevented about $1-billion in damage along cities on the Allegheny River.
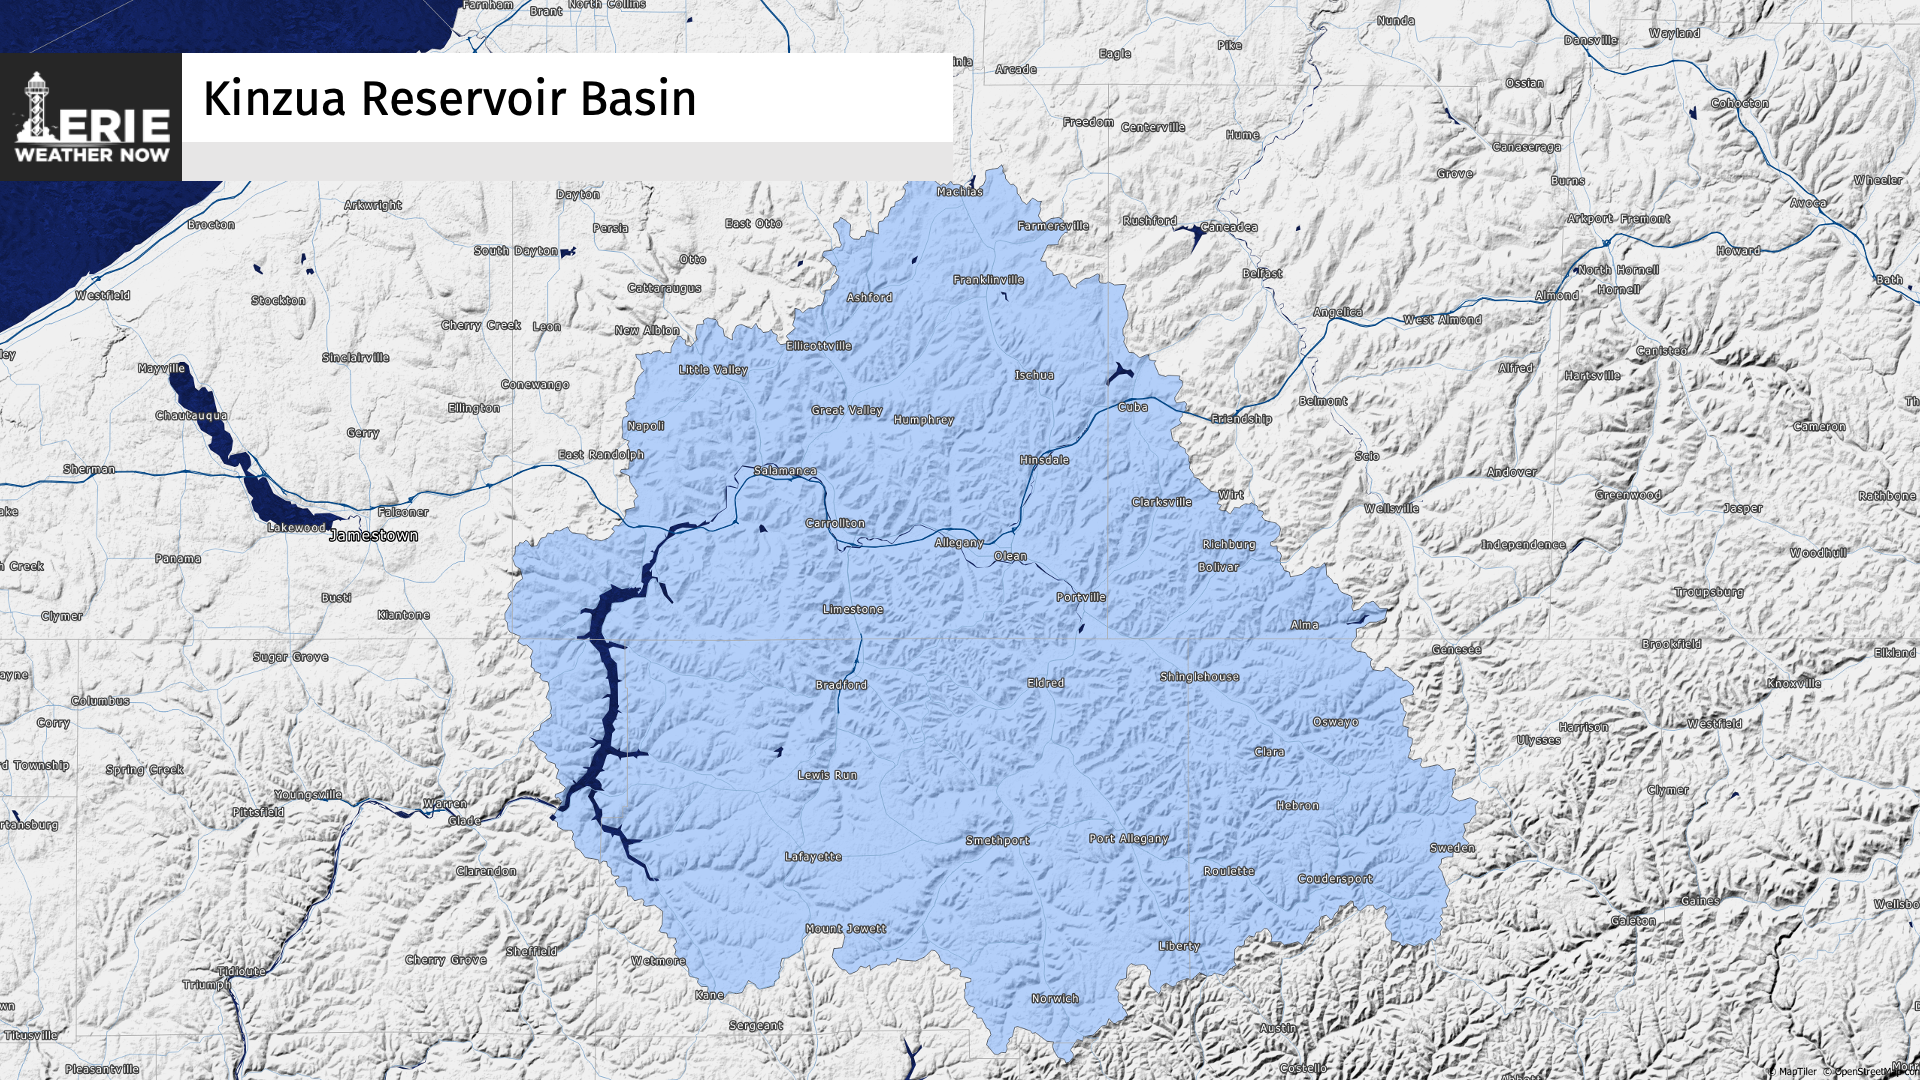
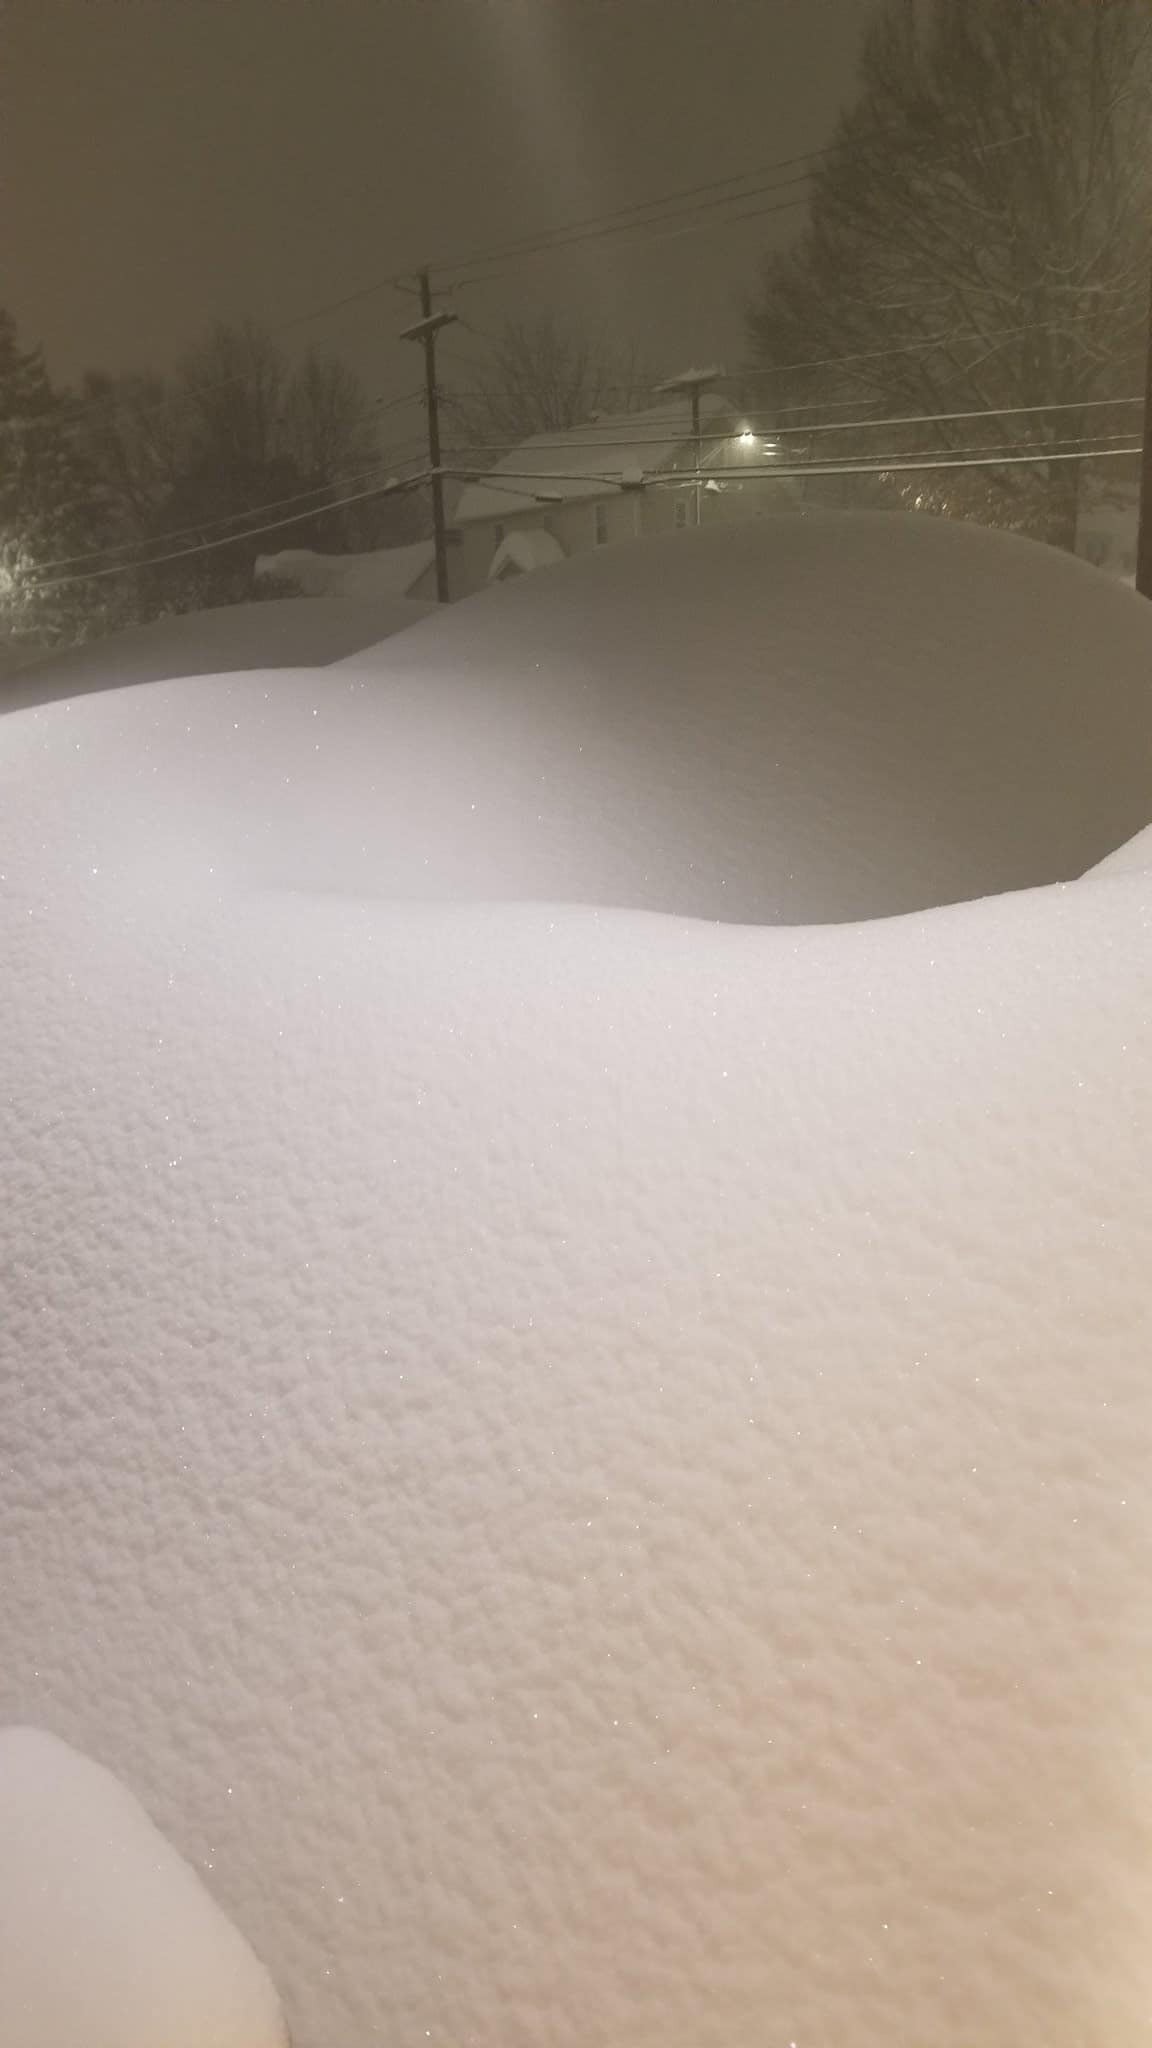
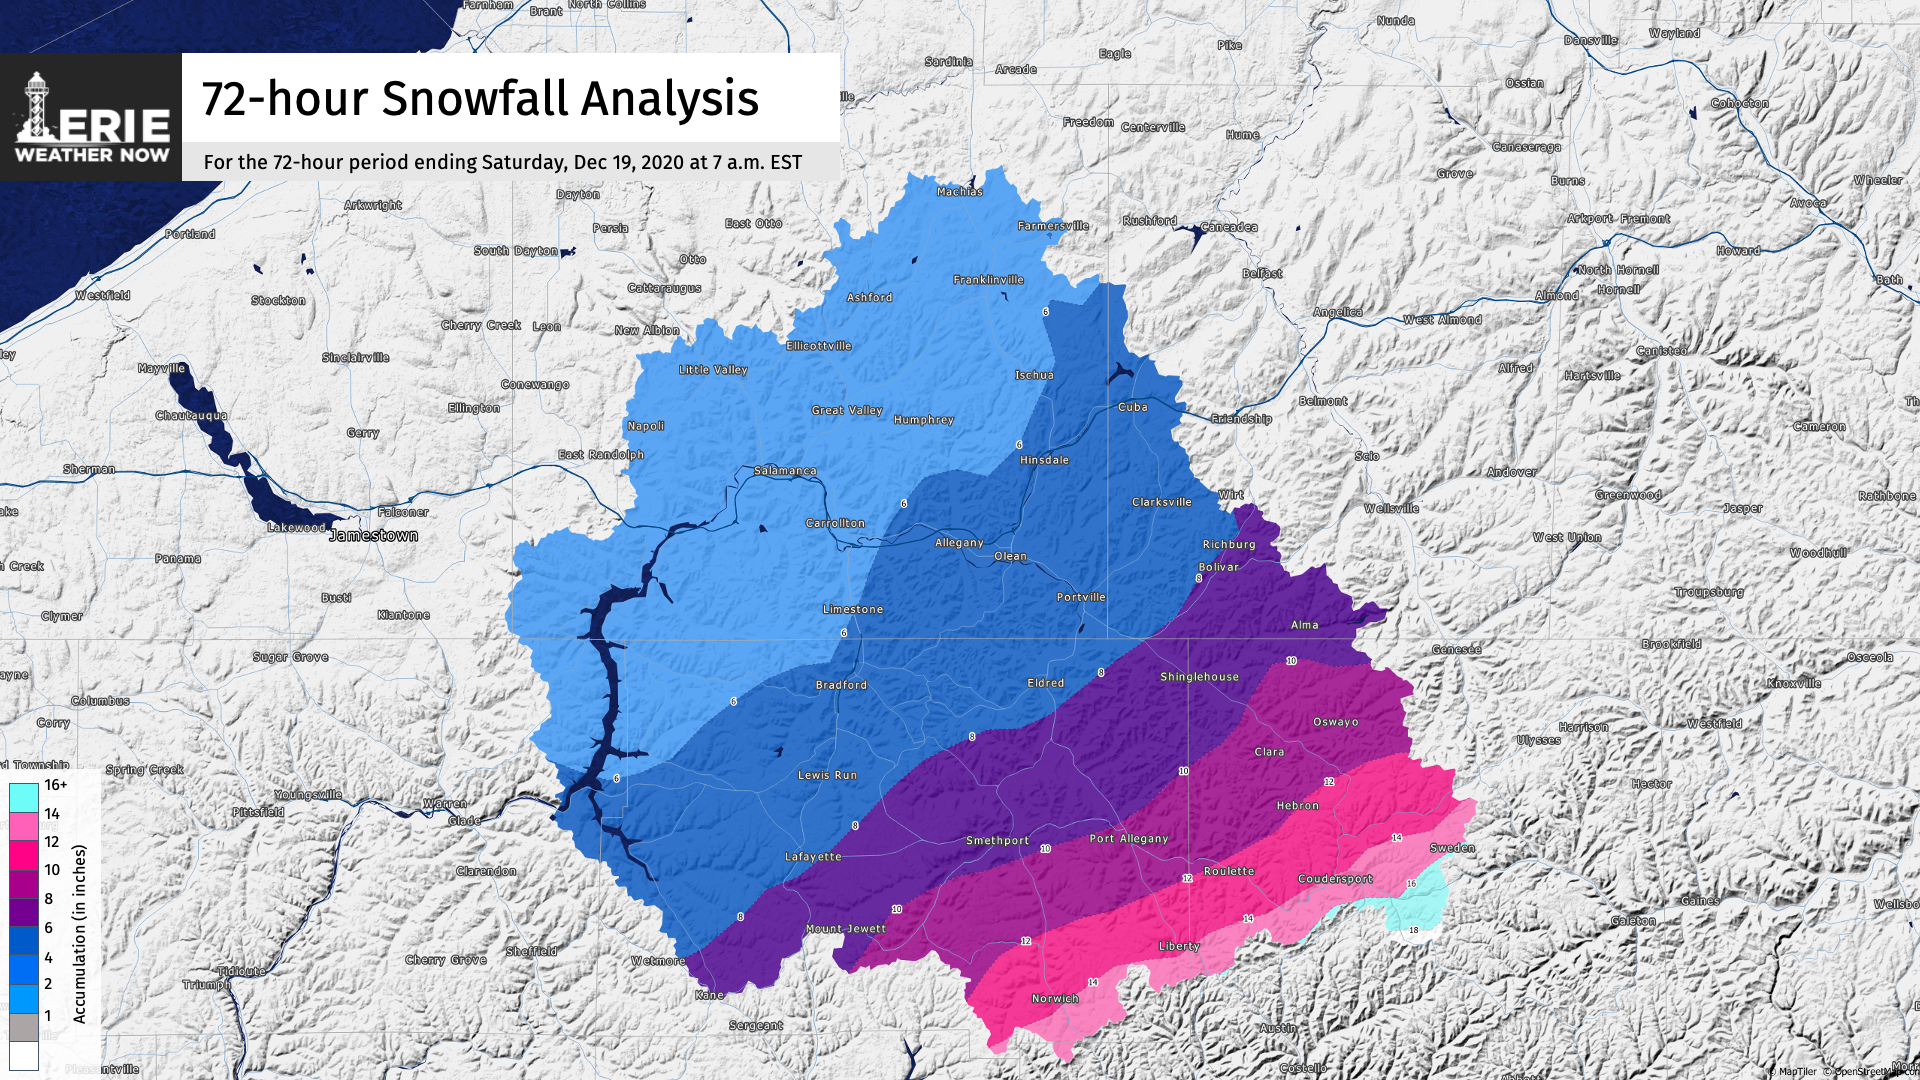
Why does this matter? The Allegheny Reservoir's Basin (the area that "feeds" the dam) received a significant amount of snow from Winter Storm Gail. Much of this basin experienced drought conditions over the spring and summer; which is why the dam reached all time lows set over the past 10 years. Here's what the reservoir looked like near Red Bridge.
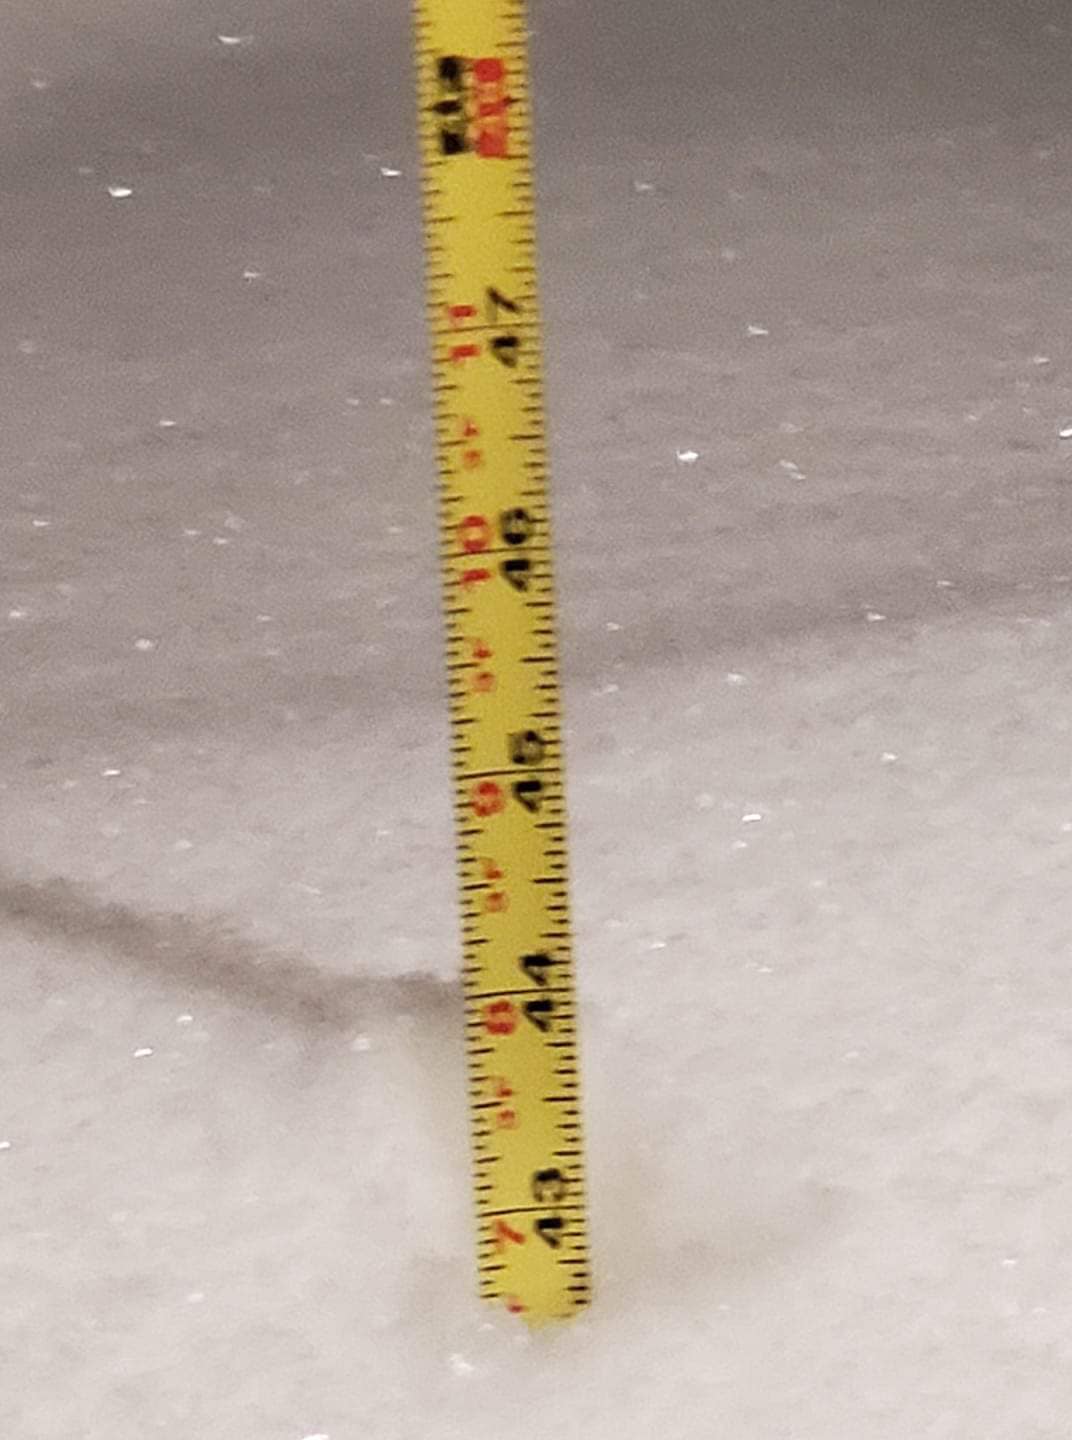
During the fall, the reservoir reached a low of about 1298 feet - typically winter pool is 1304.78 feet. Needless to say, it was an overly dry spring, summer, and fall - until winter came. Winter Storm Gail dumped anywhere from 4-18+" across the basin. While this amount of snow is not typically an issue - granted it could slowly melts and be absorbed by the ground. However, that was not the case this year.
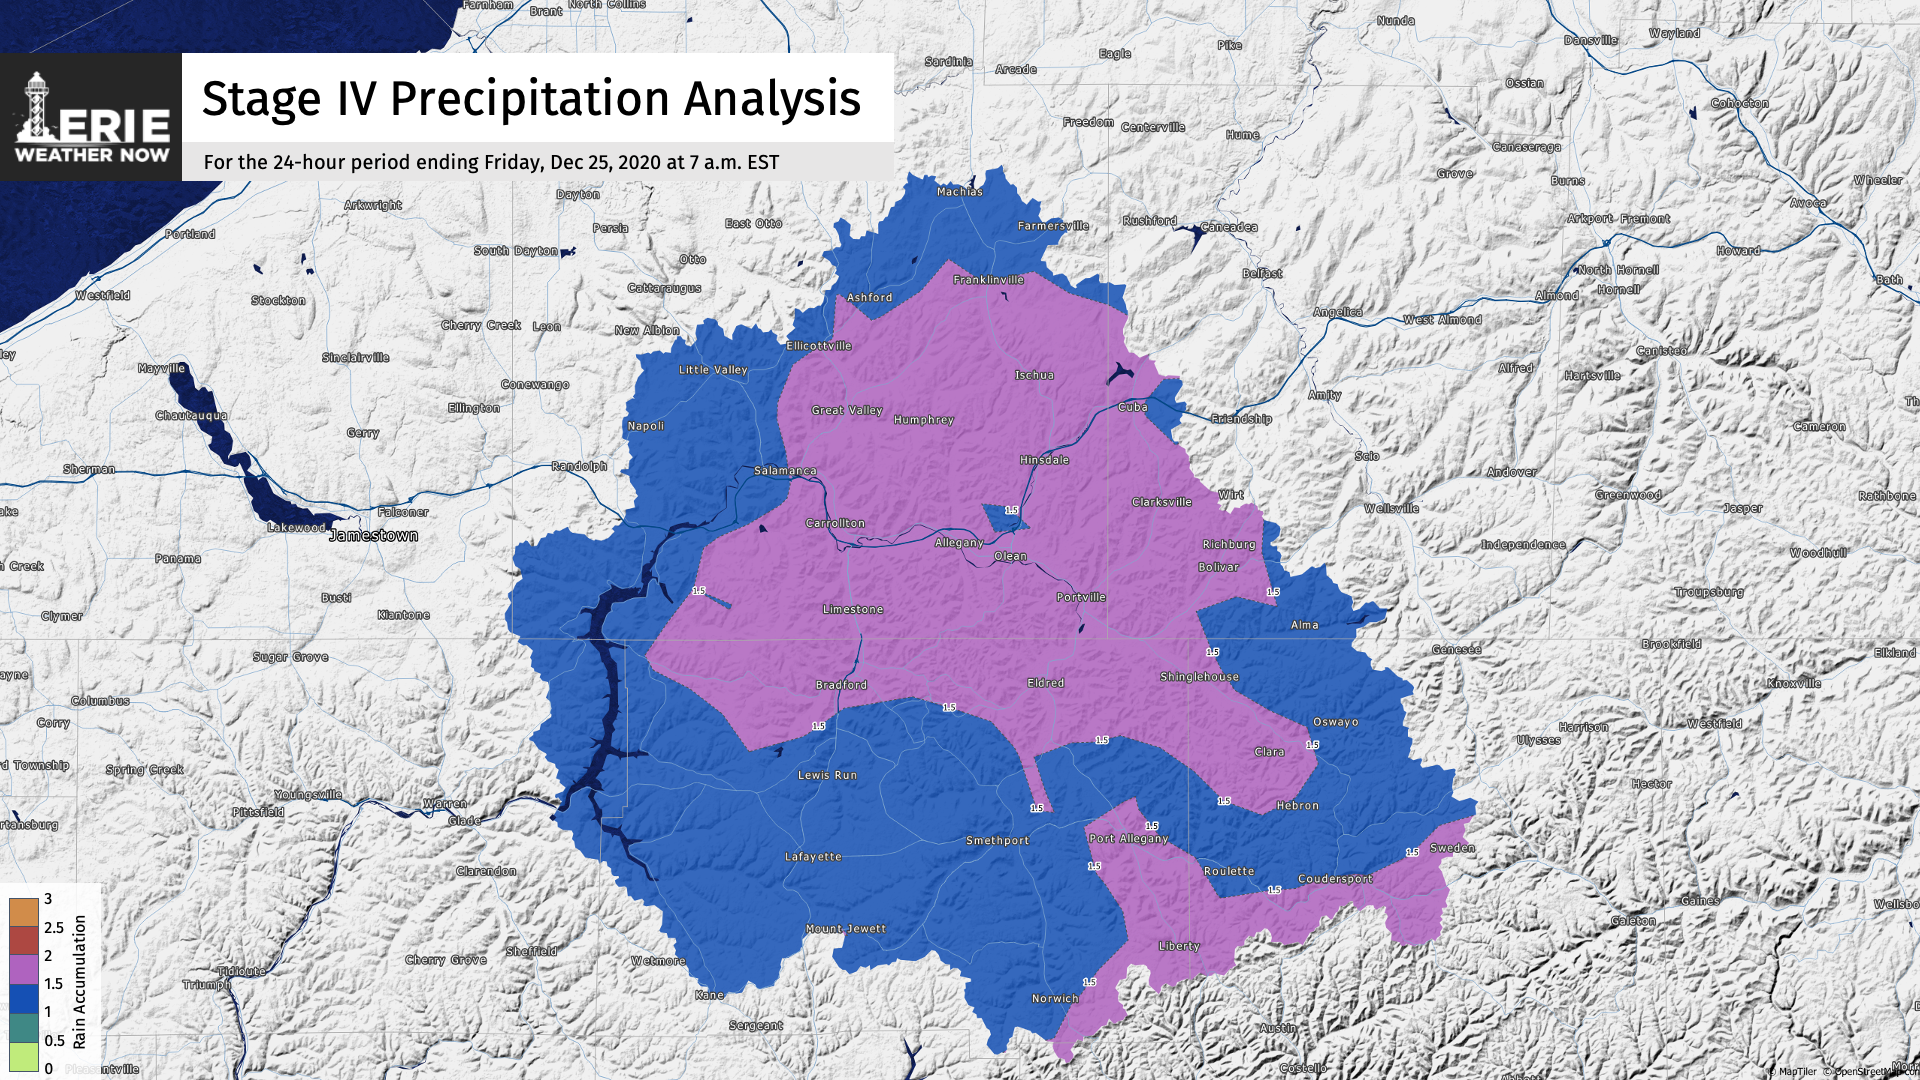
Let's revisit Christmas Eve (12/24/2020) where another powerful winter storm moved through the region bringing another hazard - rain. In a 24-hour period ending on Christmas day, as much as one inch to locally two inches of rain fell across the basin. Combining the snow pack with amount of rain added for the possibility of water run off. Luckily, the basin flows to a major holding point to prevent flooding Warren, or perhaps worse - Titusville, Pittsburgh, and beyond.
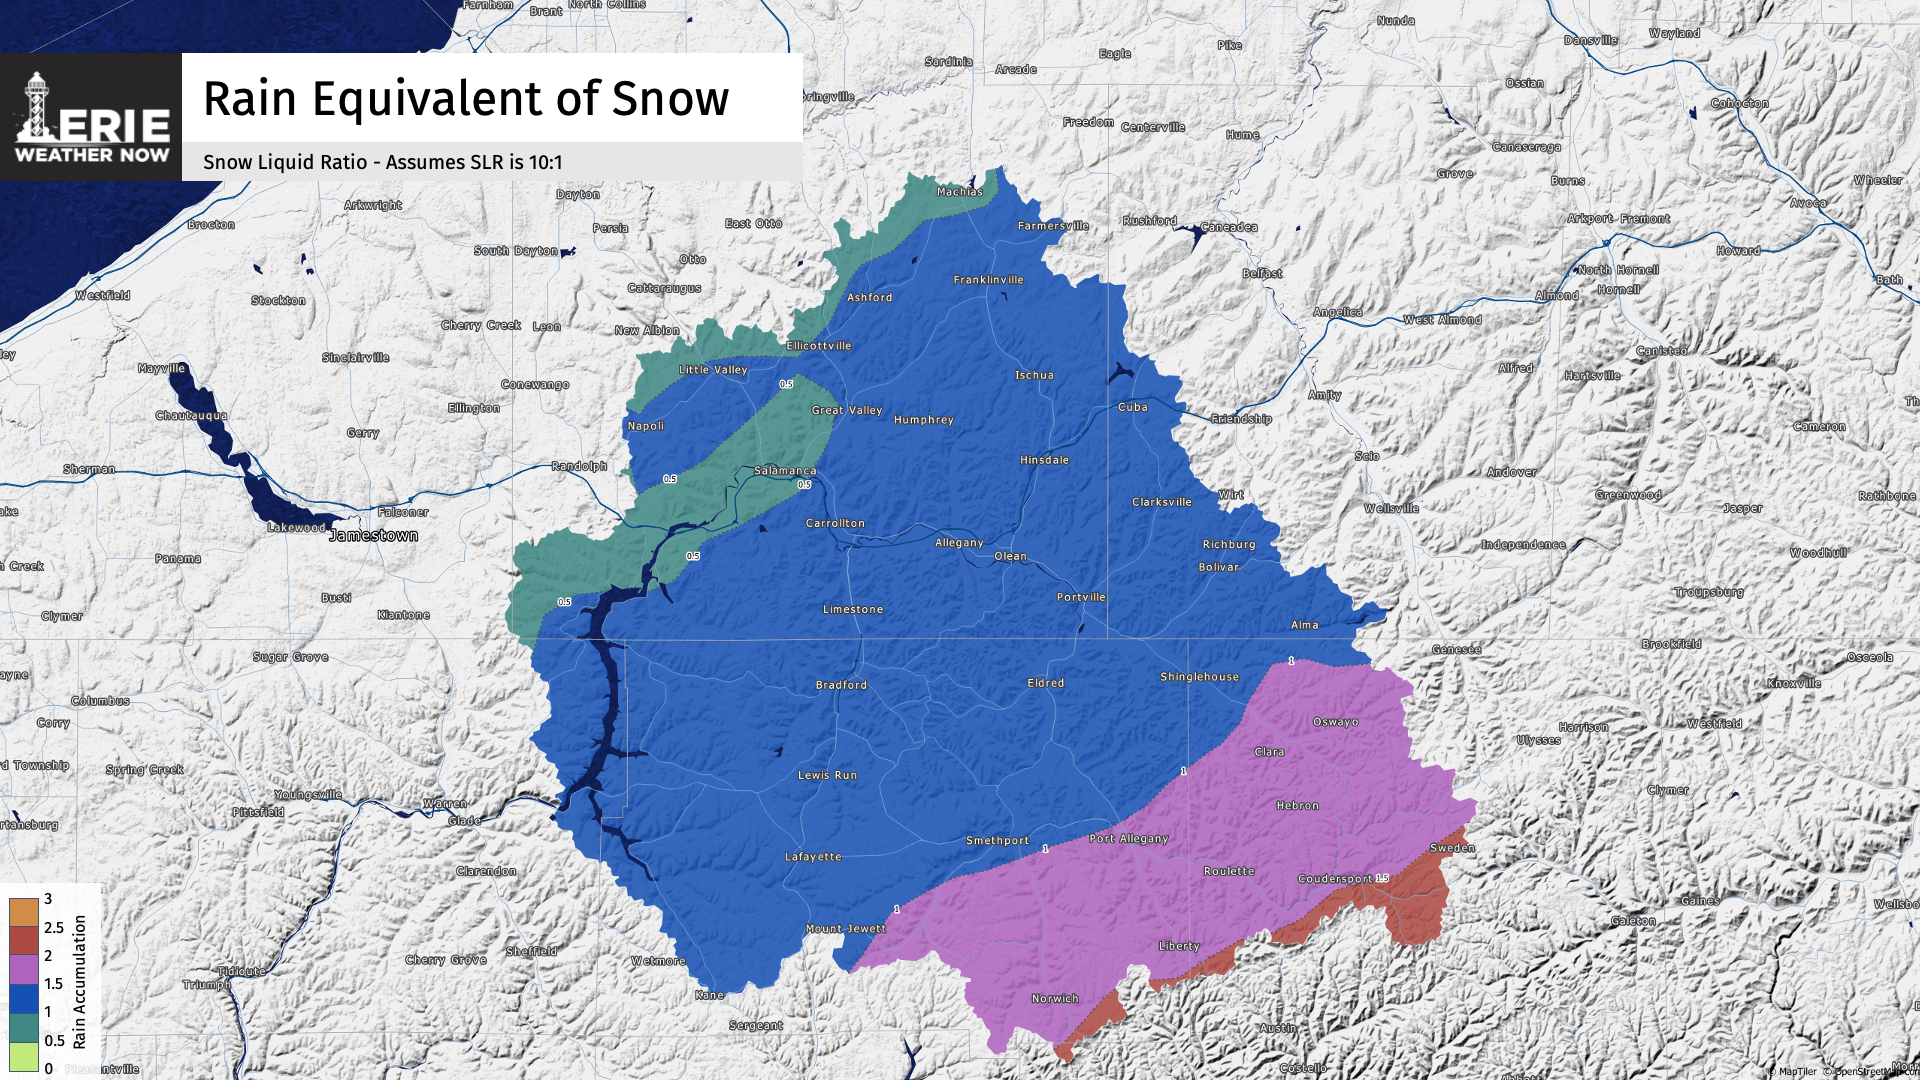
Before we can talk about the total amount of water that could have potentially ran off, we need to somehow convert a snow pack to a liquid equivalent. This is where a "Snow Liquid Ratio" (SLR) comes into play. The "average" SLR is 10:1, which means 1 inch of rain can create 10 inches of snow. We can work backwards and say that if we have 15 inches of snow, we know that there is about 1.5 inches of water - our rain equivalent.
Note: 10:1 is an average. The actual SLR will vary and the only way too actually know what the SLR should be you would need to melt snow at various locations to find out how much liquid you would get.
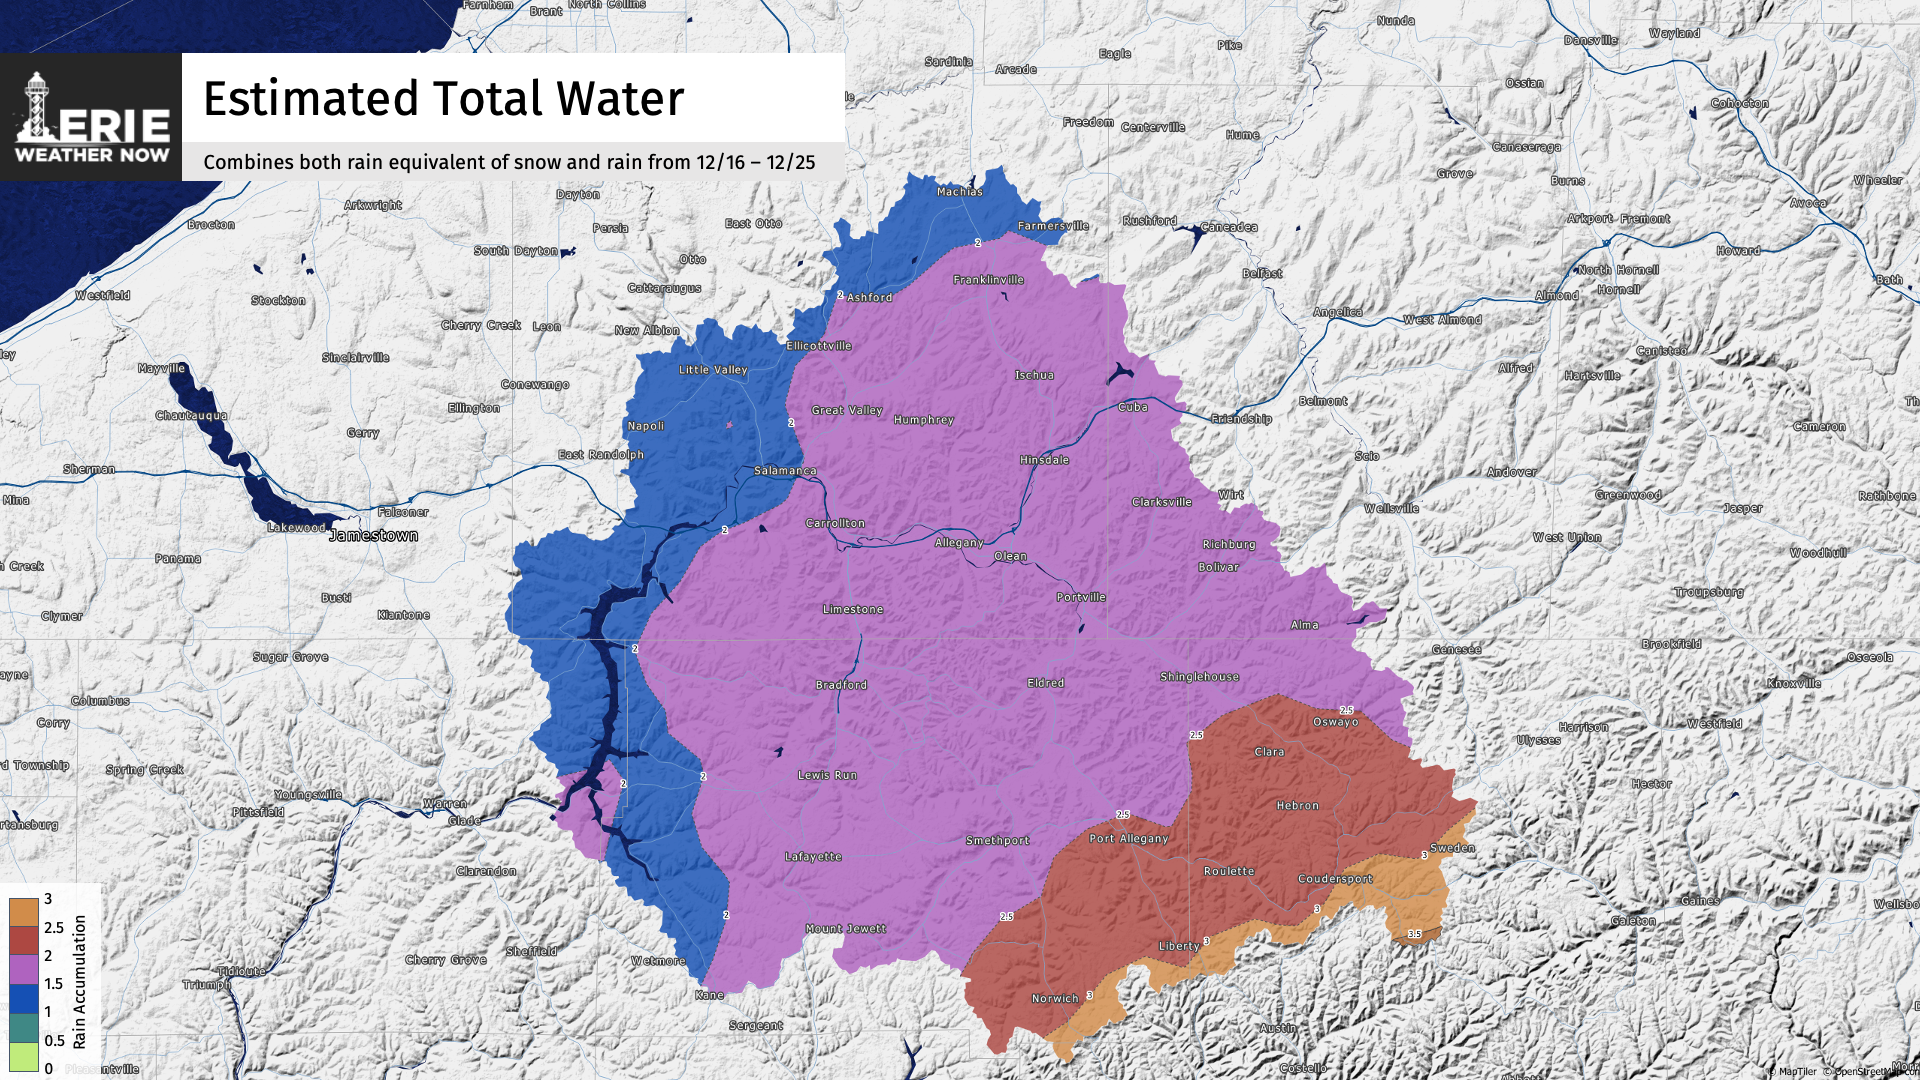
Now, to find out how much water is potentially available, we can add together our water equivalent of snow and the amount of rain that fell Christmas Eve.
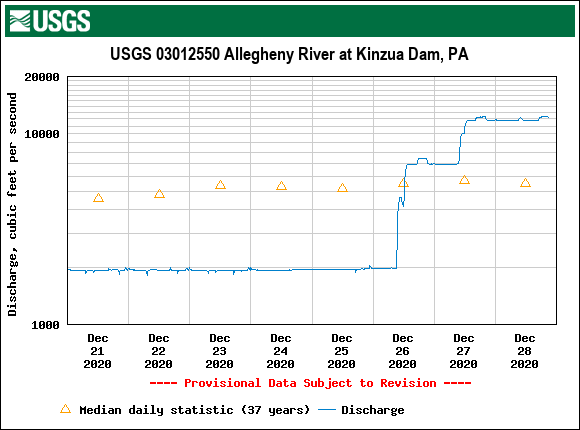
Ok, what gives? What's the big deal? In about 48 hours, the Kinzua Reservoir raised just over 5 feet. In three days, the reservoir rose almost 7 feet! This is due in part of the amount of water that was stored in the snowpack.
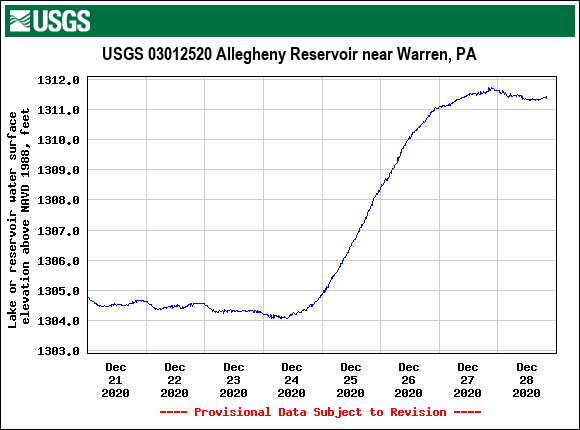
In order to prevent from filling the entire dam (as winter is not over and we could have additional snow and rain, the Army Corps of Engineers are having to release over 11,000 cubic feet per second of water in order to maintain the pool at just under 1312 feet. This is forecasted to continue through at least the end of the week due to the amount of water that is still flowing down the Allegheny River into the reservoir.
At Erie Weather Now, I'm committed to bringing stories of how weather relates to our lives and our region.